Walkthrough · No. 04
Data Maps: Guided discovery across 990 datasets, seed to market
How a keyword-searchable catalogue of agriculture datasets became a ten-stage map from seed to market.

§ 01 Problem
The problem
Dataful holds hundreds of agriculture datasets. Keyword search suits people who know what they want; for everyone else the catalogue was a wall.
§ 02 Information and data
What made it hard
-
Datasets differ in level (all-India, state, district), frequency and time coverage.
-
Relevant data sits in other sectors: bank credit, trade, rural crime.
-
The catalogue keeps growing, so any hand-built structure goes stale.
§ 03 Workflow and design
The decisions that shaped it
D1
A narrative taxonomy, not a filing system
Ten stages that follow the farming year, from Land & Soil to Trade & Economy.
D2
Three shapes of collection
A state grid for state-wise data, one card per crop or commodity, a plain list otherwise.
D3
Cross-sector by design
Datasets from other sectors are included and flagged.
D4
Generated, versioned, static
Produced from the catalogue as a dated bundle; it regenerates as the catalogue grows.
§ 04 Shipped, not planned
What it actually does
- Sector → stage → collection → dataset drill-down, in English and Hindi
- State grids for state-wise data; one card per crop or commodity
- Every dataset links to its Dataful page: preview, metadata, citation, downloads
§ 05 Input → steps → output
Walkthrough
-
Input
The Dataful agriculture catalogue: several hundred datasets plus related datasets from other sectors.
-
Step 1: Start at the sector
The root node shows the sector and its ten stages. A newcomer picks “Rain & Water” and is right.
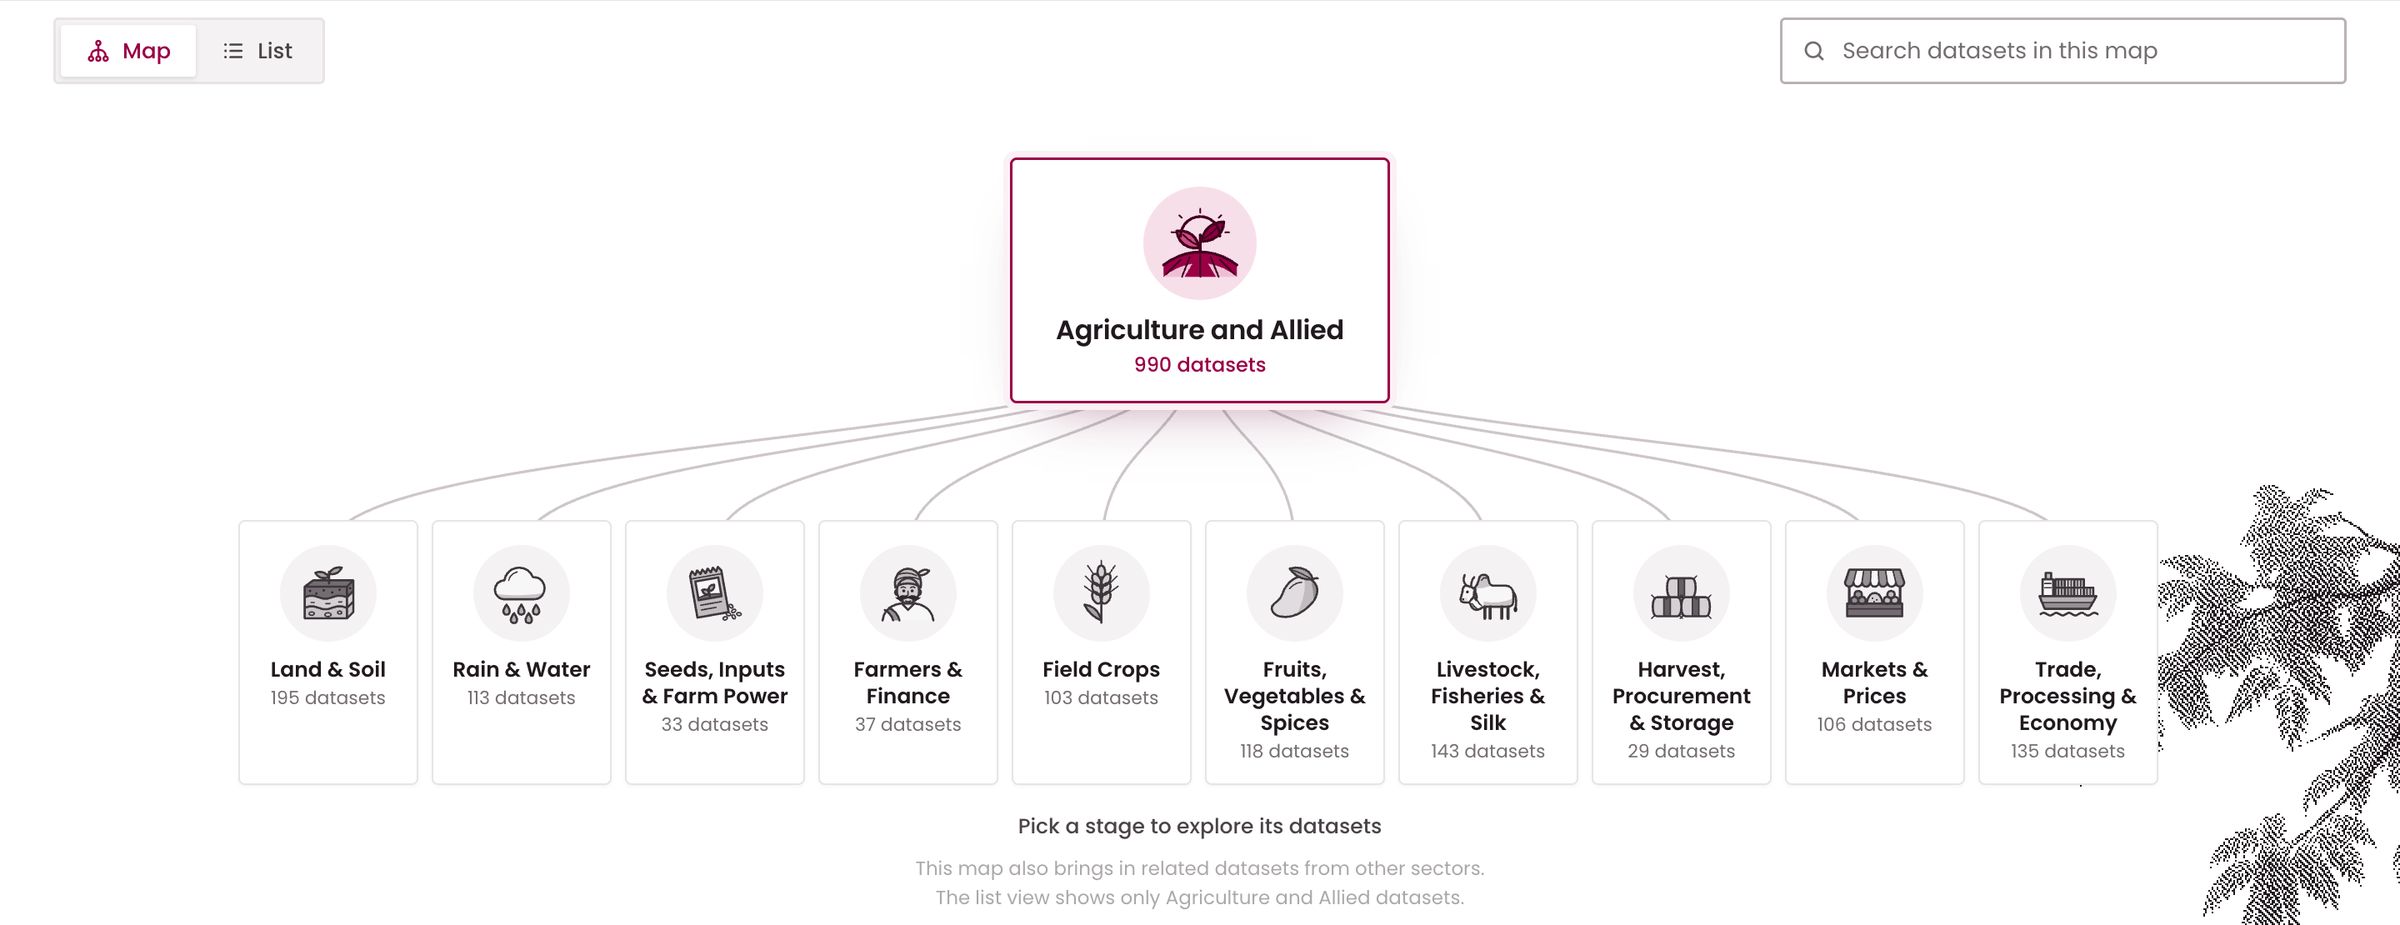
Fig. 2 The root of the map: one sector, ten stages. -
Step 2: Open a stage
Rain & Water: 113 datasets in seven collections, with their source sectors.
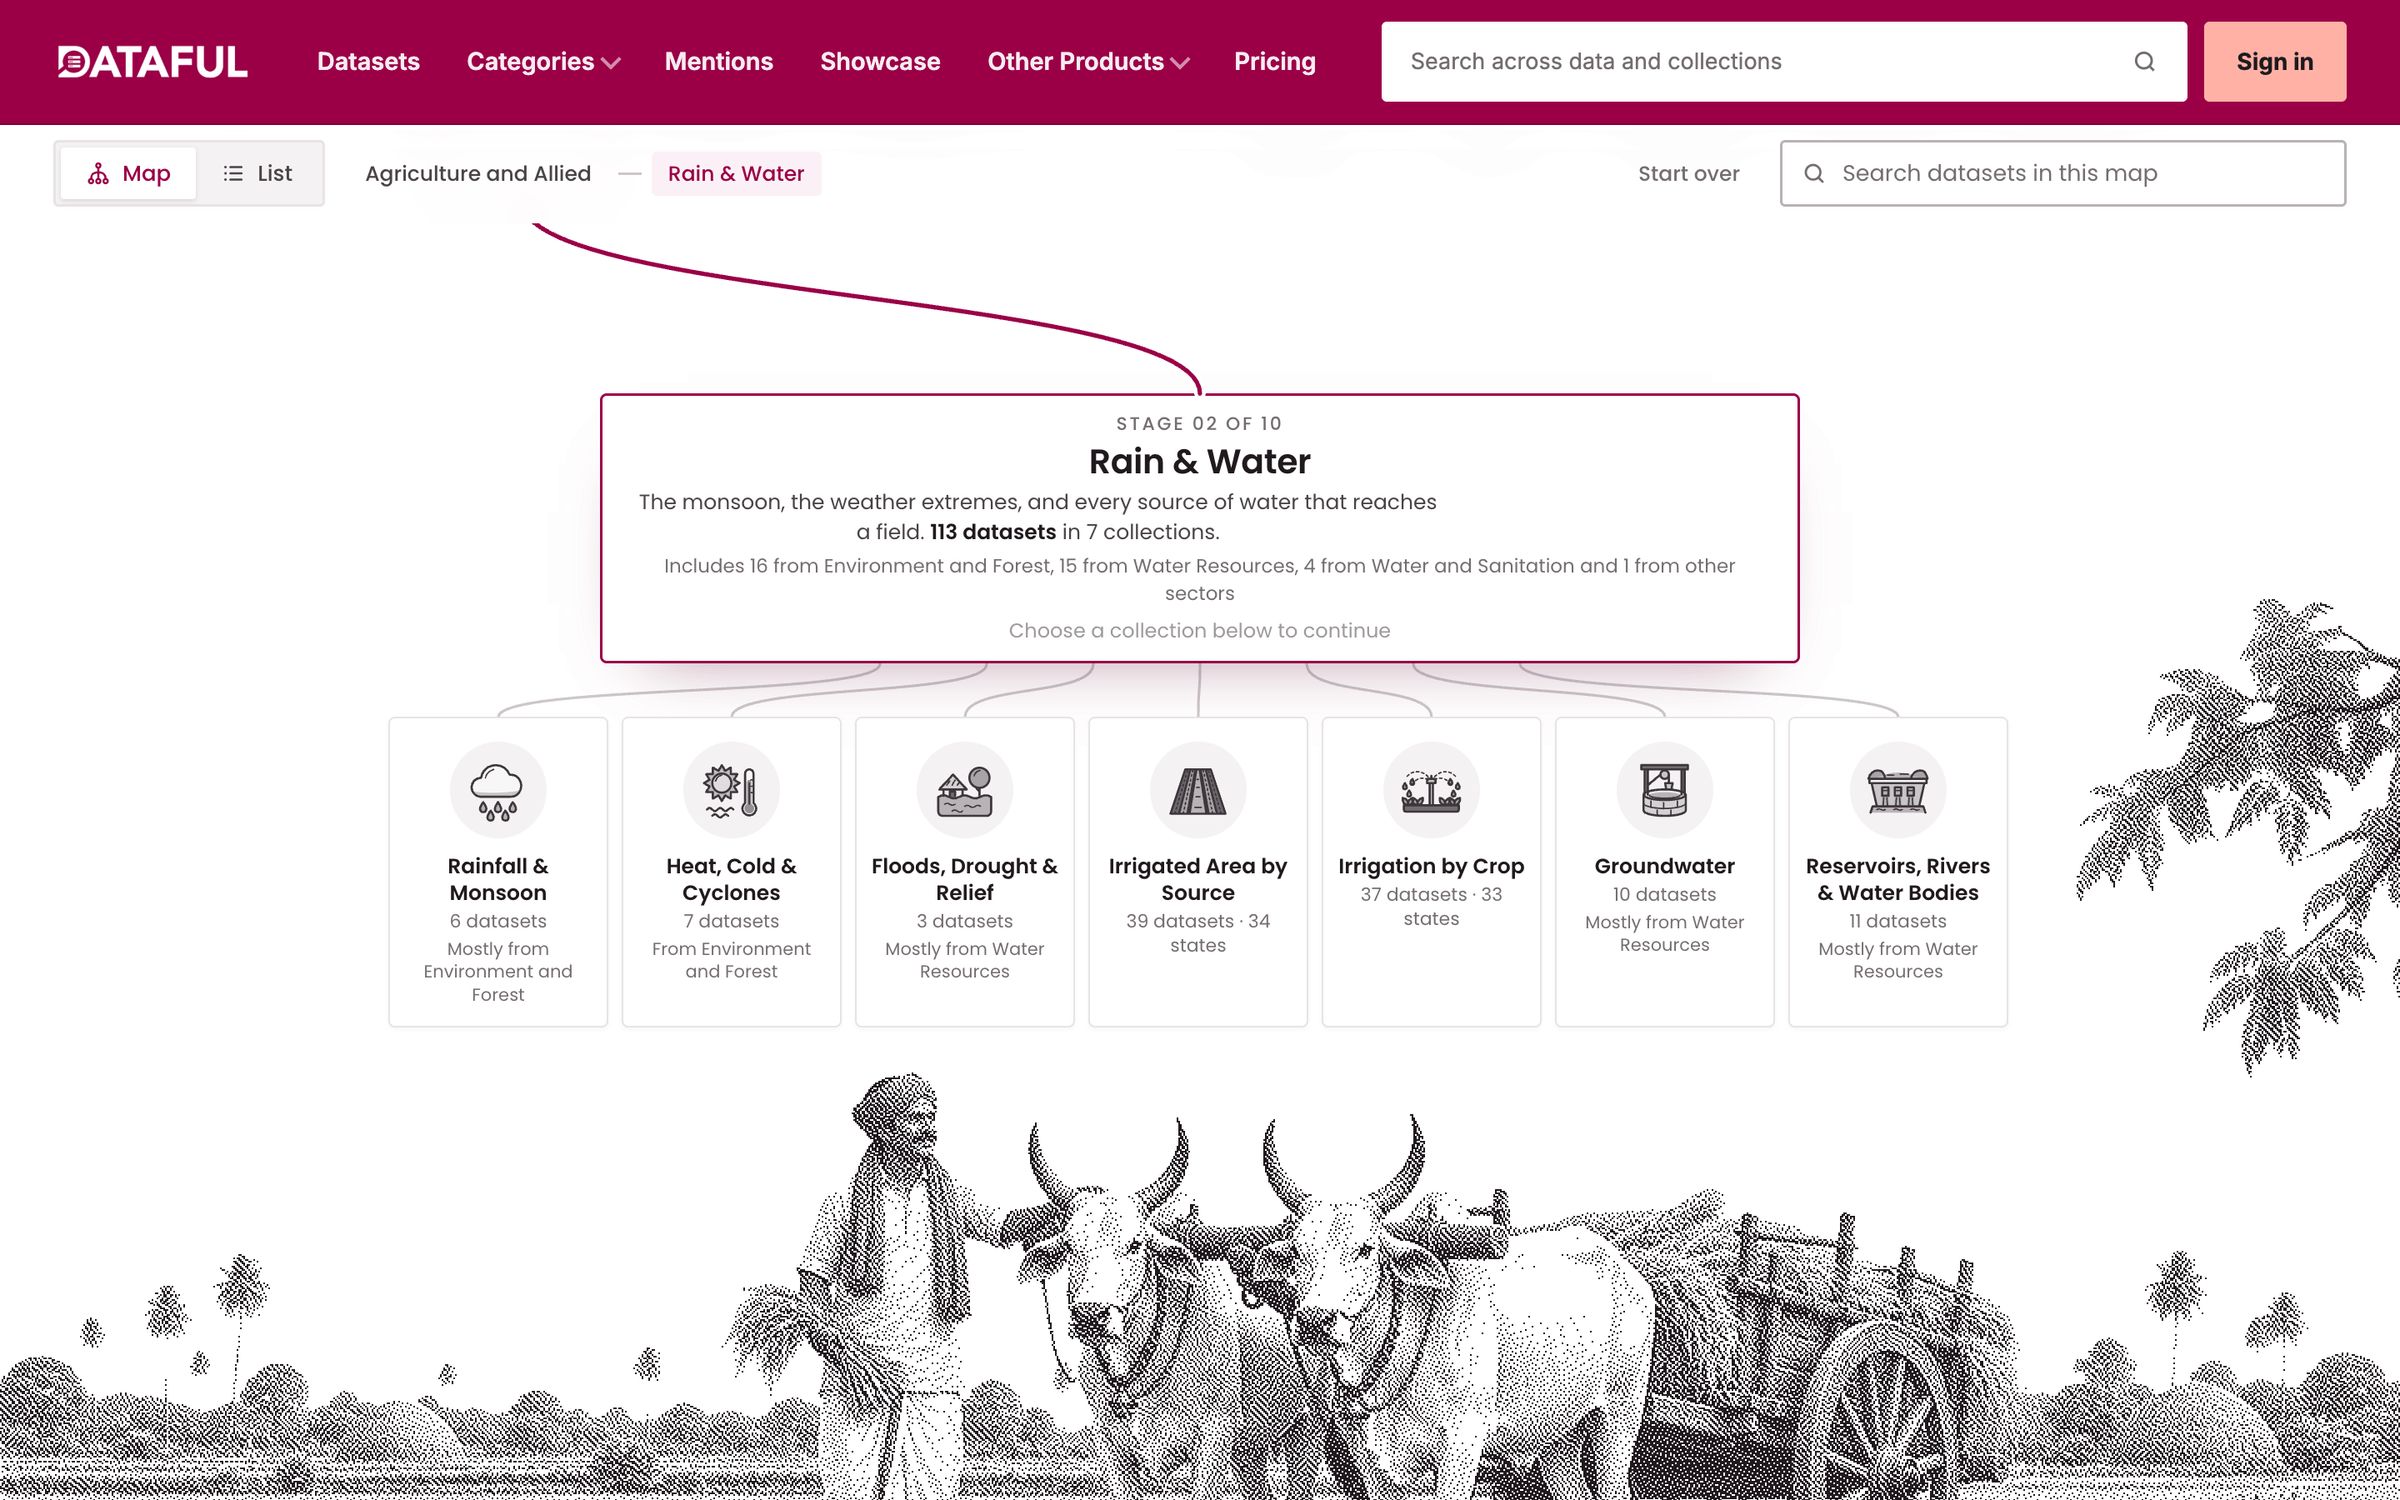
Fig. 3 A stage and its collections. -
Step 3: Open a collection
Irrigated Area by Source is state-wise, so it renders as a grid of states.
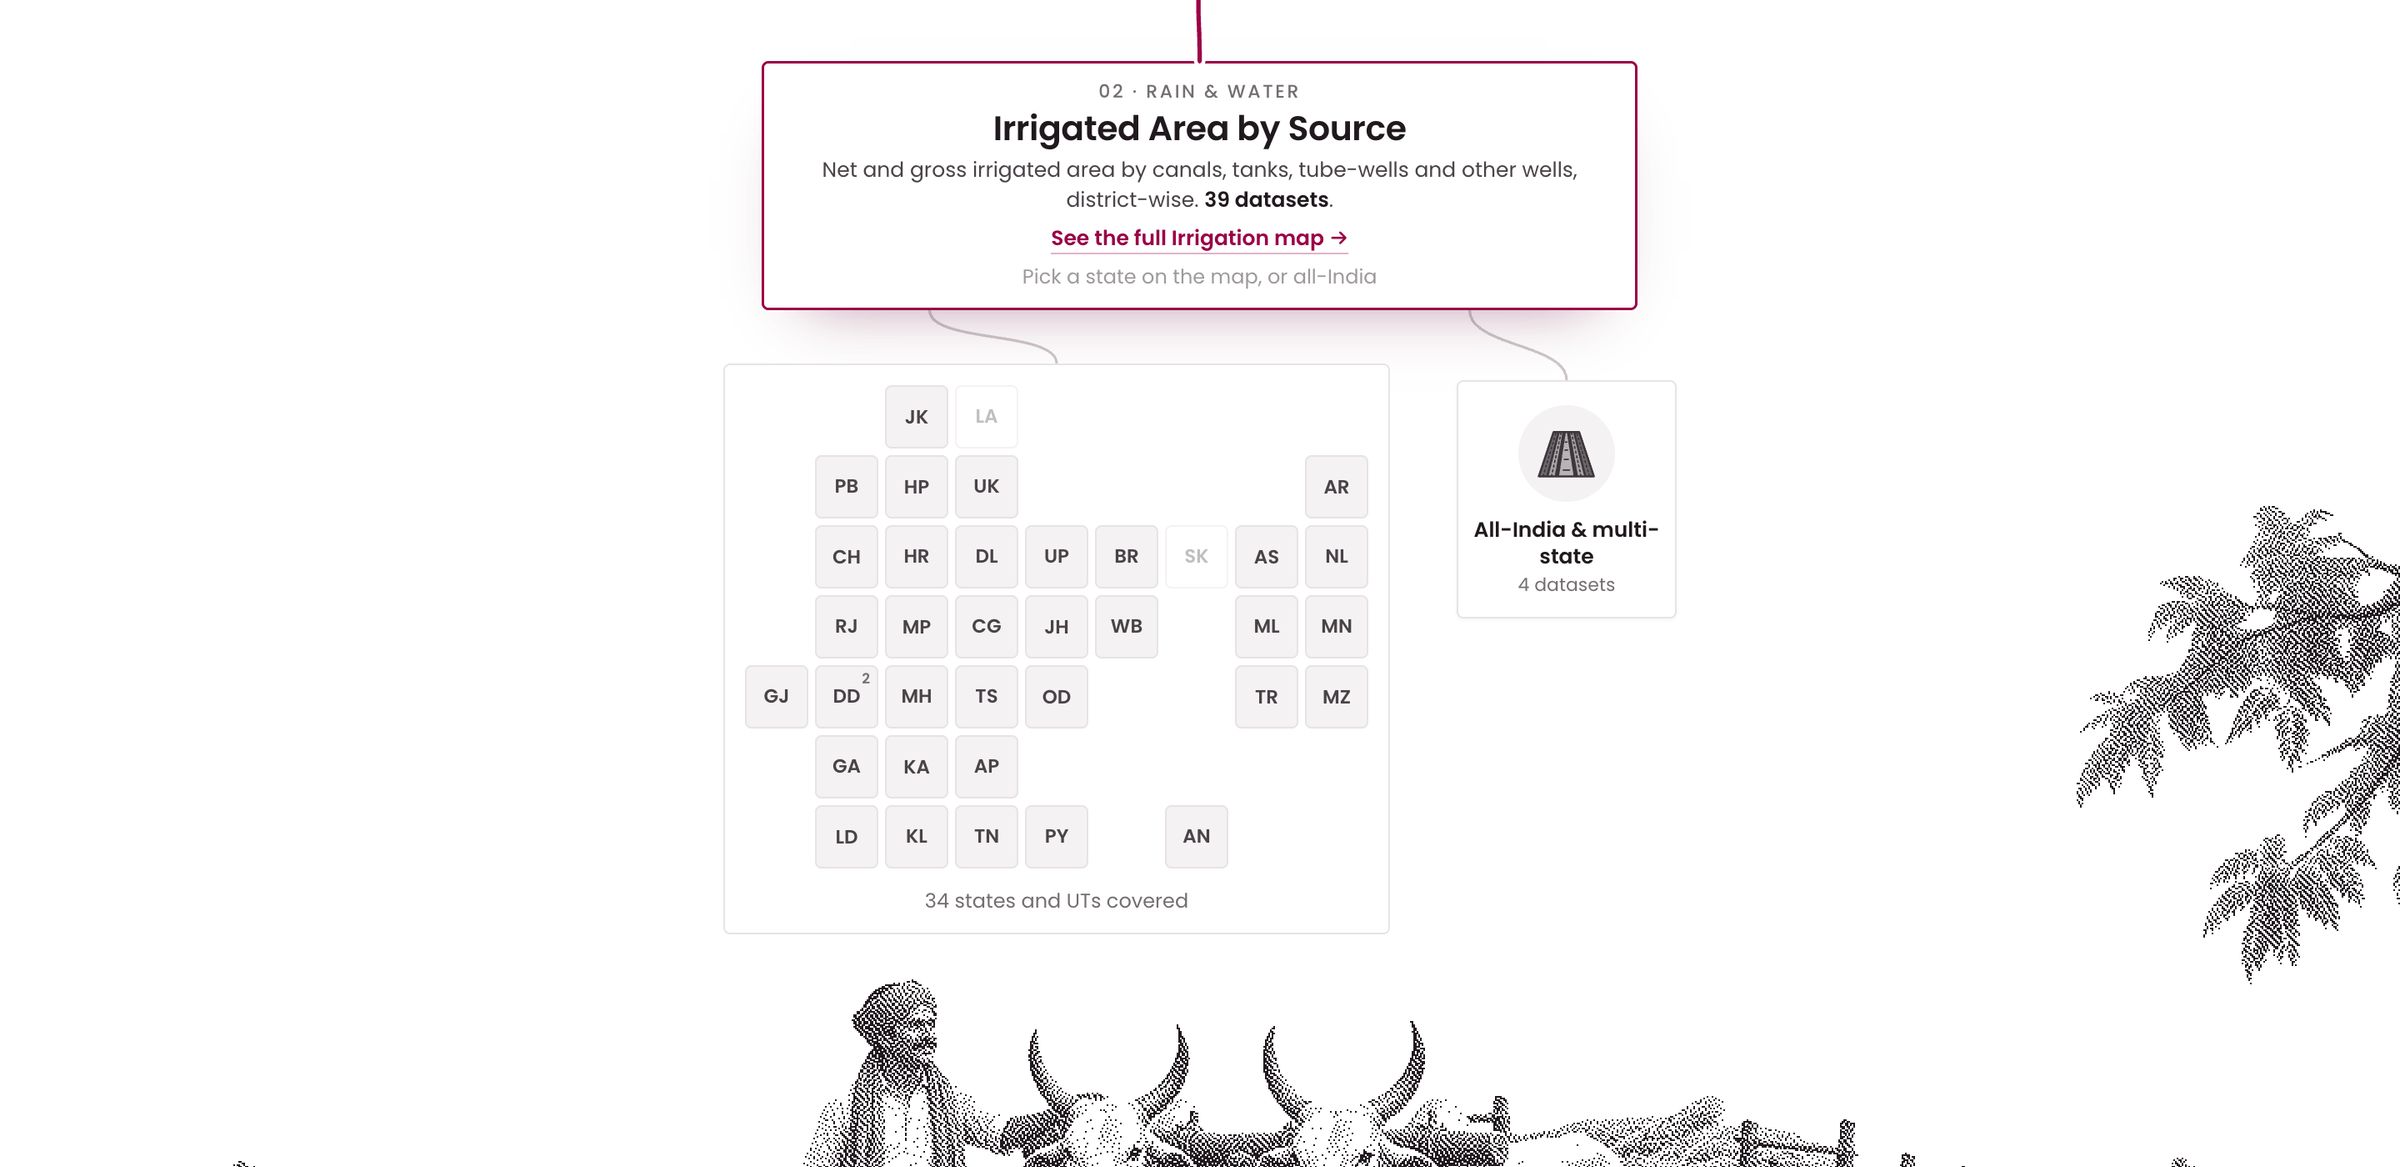
Fig. 4 A collection as a state grid. -
Step 4: Land on the dataset
Each tile opens the dataset’s Dataful page.
-
Output
From “what do we know about irrigation in Telangana?” to a documented table in four clicks.


§ 06 Evaluation
How we check it
-
Every agriculture dataset is reachable from a stage; cross-sector datasets are flagged.
-
The map regenerates from the catalogue, so coverage is re-checked on each release.
§ 08 Limitations and lessons
Limitations and lessons
read this part first
Limitations
- Only the agriculture map is live so far.
- A dataset that fits two stages appears where it is most useful: a judgement.
Lessons from operation
- Taxonomy is a product decision. The seed-to-market story makes the map usable by newcomers.
- A growing catalogue needs a generated structure, not a hand-edited one.
- Show the shape of the data before the data.
Sources (3)
- [1] Agriculture Data Map catalogue (bundle of 2026-10-16) · datamaps.dataful.in (opens external site)
- [2] Data Map: Agriculture and Allied · dataful.in (opens external site)
- [3] Dataful: a dataset page · dataful.in (opens external site)
Sources reviewed 15 November 2026.
Discuss a project
Have a catalogue people cannot navigate?
We design the taxonomy and build the map or portal around it.