Walkthrough · No. 03
CSR Insights: A domain application on a general engine
How a decade of CSR filings from 45,000+ companies became an application anyone can question in plain language: a Dataful dataset plus GoPie.

§ 01 Problem
The problem
Larger Indian companies must spend 2 per cent of profit on CSR and report it. The filings are public, but “who funds health projects in Hyderabad, and how much?” meant downloading, cleaning and joining tables by hand.
§ 02 Information and data
What made it hard
-
Company identity drift: identifiers change on listing, names vary, mergers need a successor.
-
District names as written by companies versus official Local Government Directory codes.
-
Projects tagged “PAN India” or with no location, which must not be mistaken for a state.
-
The ministry’s own caveat that portal data is not guaranteed complete.
§ 03 Workflow and design
The decisions that shaped it
D1
Standardise once, in Dataful
Documented rules for listing changes, entity names, mergers and district codes, applied once.
D2
Reuse the engine
GoPie provides the agent, dashboards and reports; CSR Insights adds the dataset and the interface.
D3
Three guided modes, not a blank chat
Chat with data, generate a dashboard, generate a report, each with example prompts.
D4
Publish the data journey
An About the data page explains the sources and the standardisation.
D5
Re-skin for the next domain
BRSR Insights applies the pattern to sustainability disclosures, adding the filings so answers cite the PDF.
§ 04 Shipped, not planned
What it actually does
- Plain-language questions over CSR filings from 45,000+ companies, 2014-15 to 2024-25, SQL shown
- Dashboards from a prompt: KPI tiles, rankings and charts by state, sector, company and year
- Narrative reports with charts, tables and executive summary, frozen and exportable
§ 05 Input → steps → output
Walkthrough
-
Input
Dataful’s standardised CSR master dataset, built from company disclosures on the National CSR Portal.
-
Step 1: Choose a mode
Chat with the data, generate a dashboard or generate a report, each with example prompts.
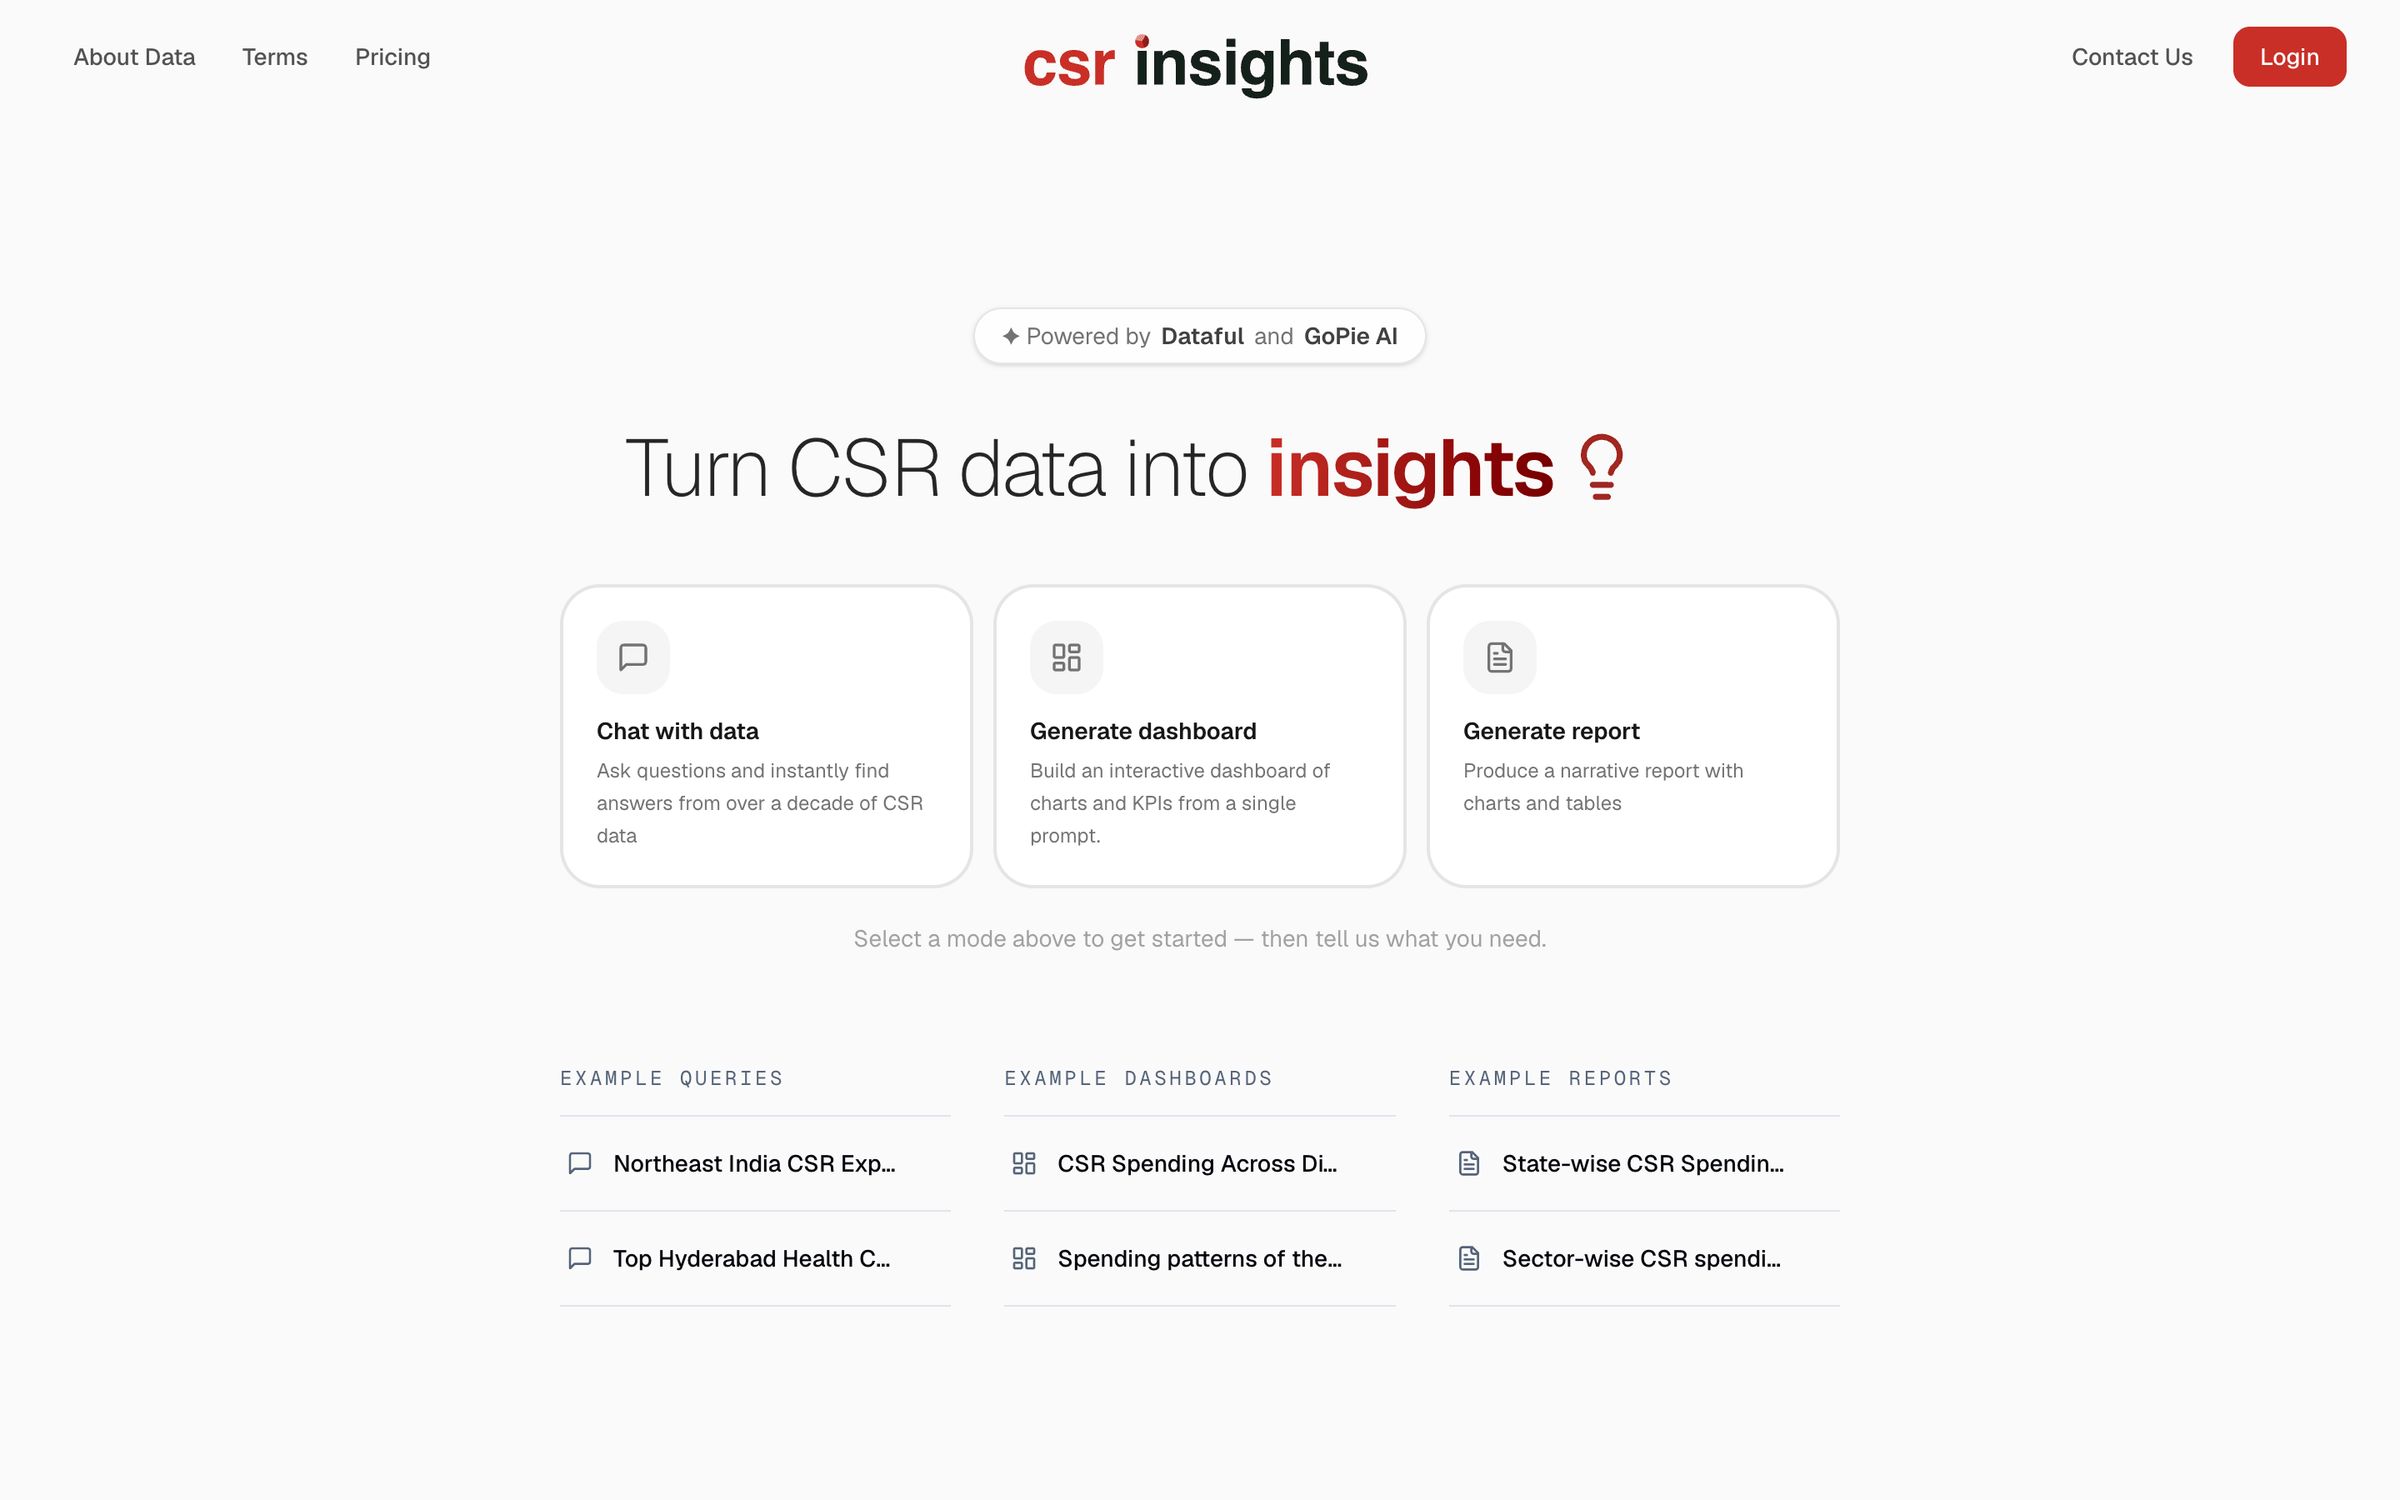
Fig. 2 Three guided modes. -
Step 2: Ask and see the query
“What was the CSR expenditure in each state of Northeast India in 2024-25?” The agent lists the states, SQL visible.
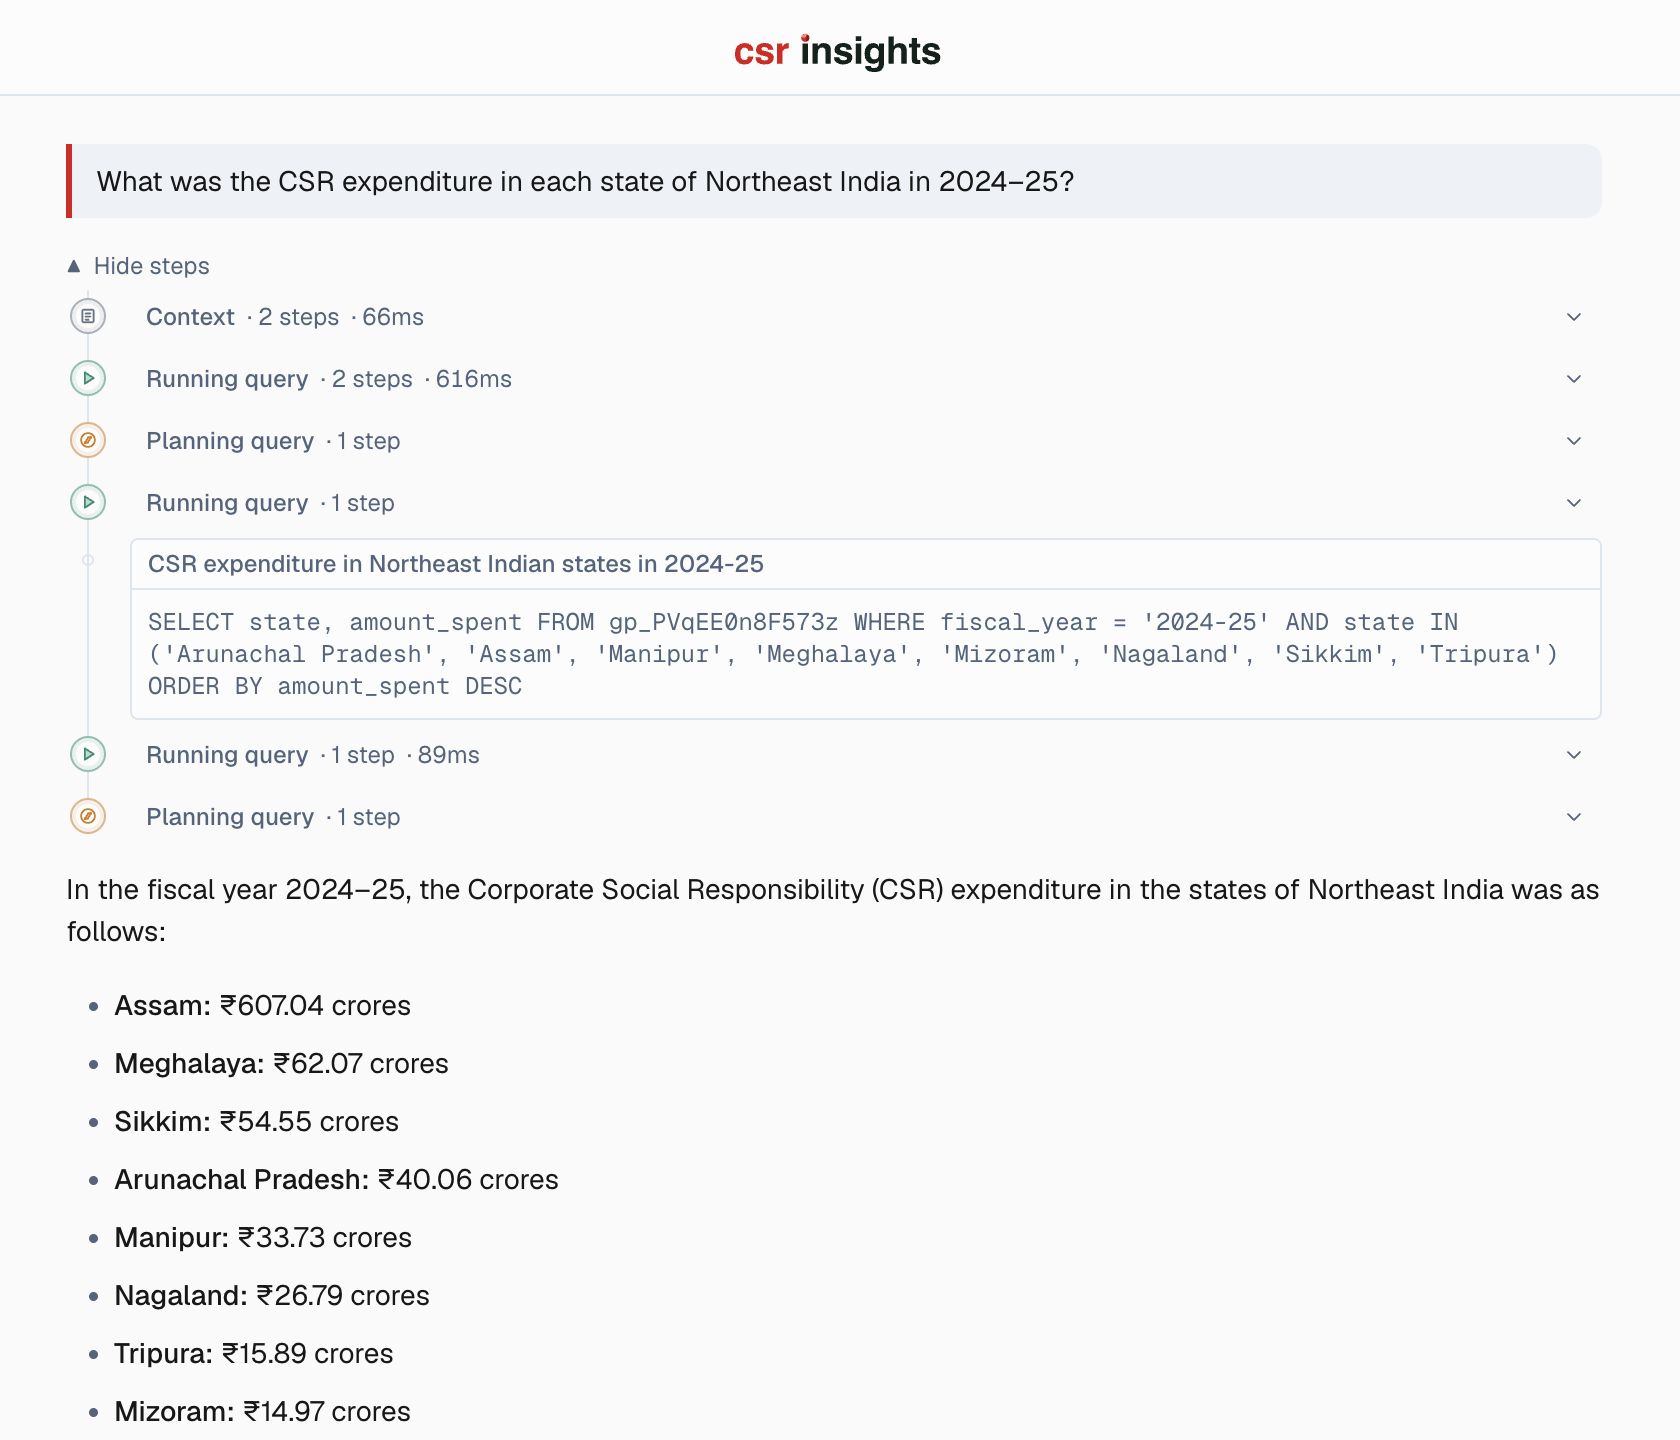
Fig. 3 Question, steps, SQL, answer. -
Step 3: Generate a dashboard
One prompt produces KPI tiles, the top states and spending by sector, refinable by chat.
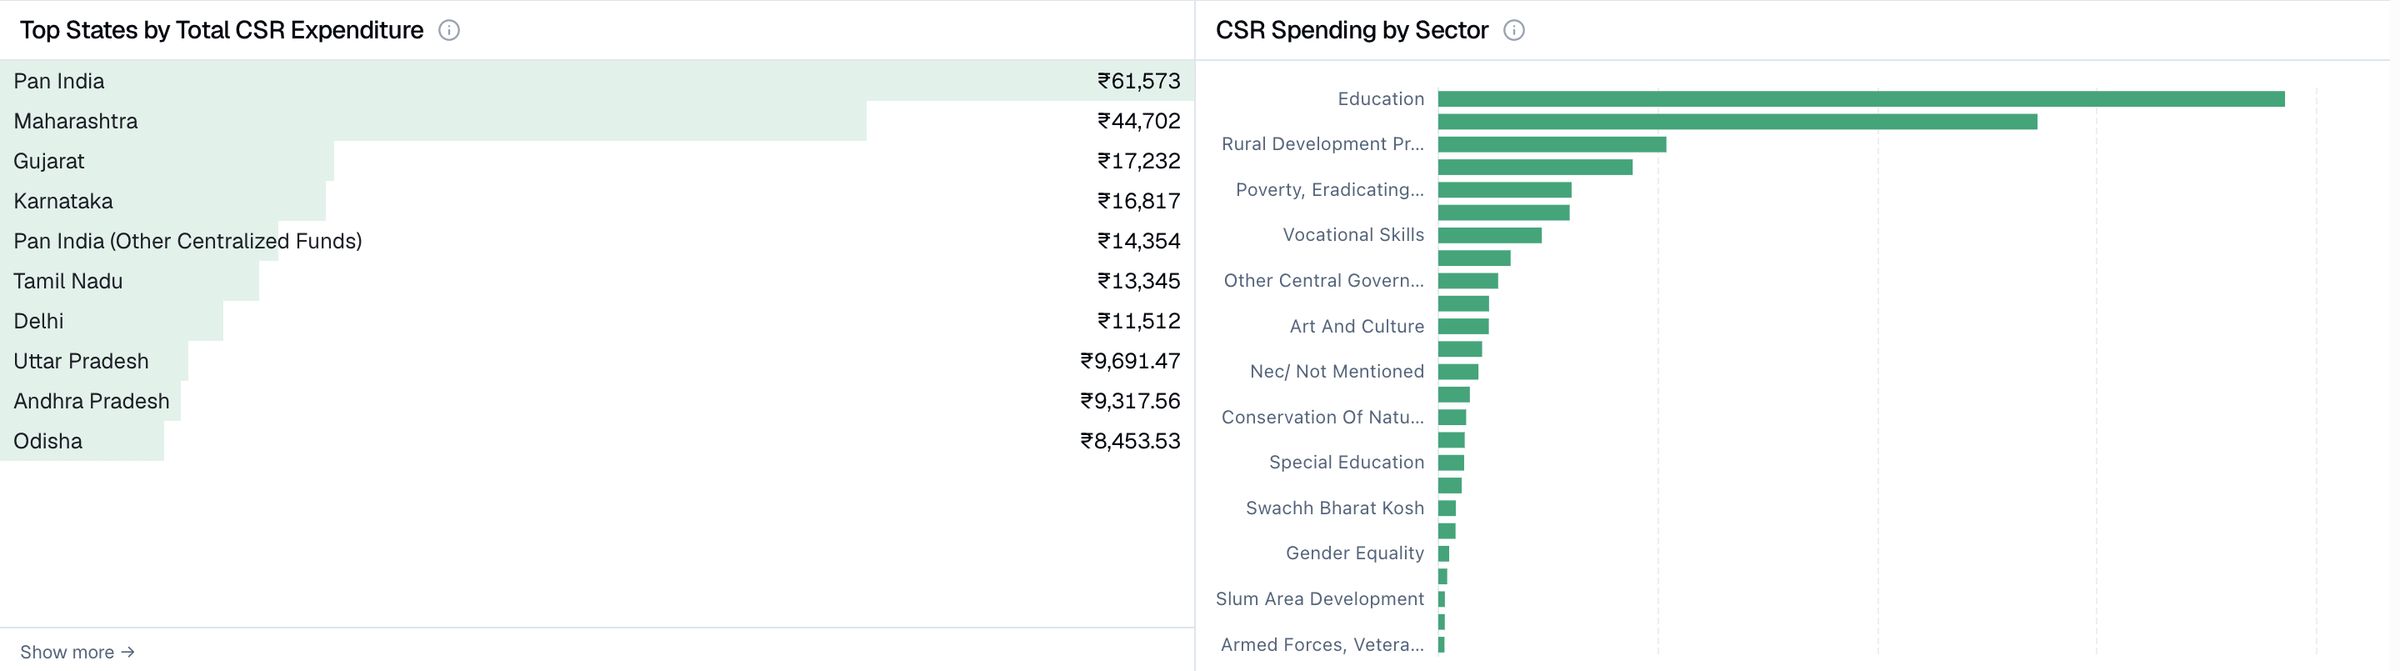
Fig. 4 The dashboard. -
Step 4: Generate a report, then review it
A state-wise report for 2024-25: summary, charts, tables, frozen for review.
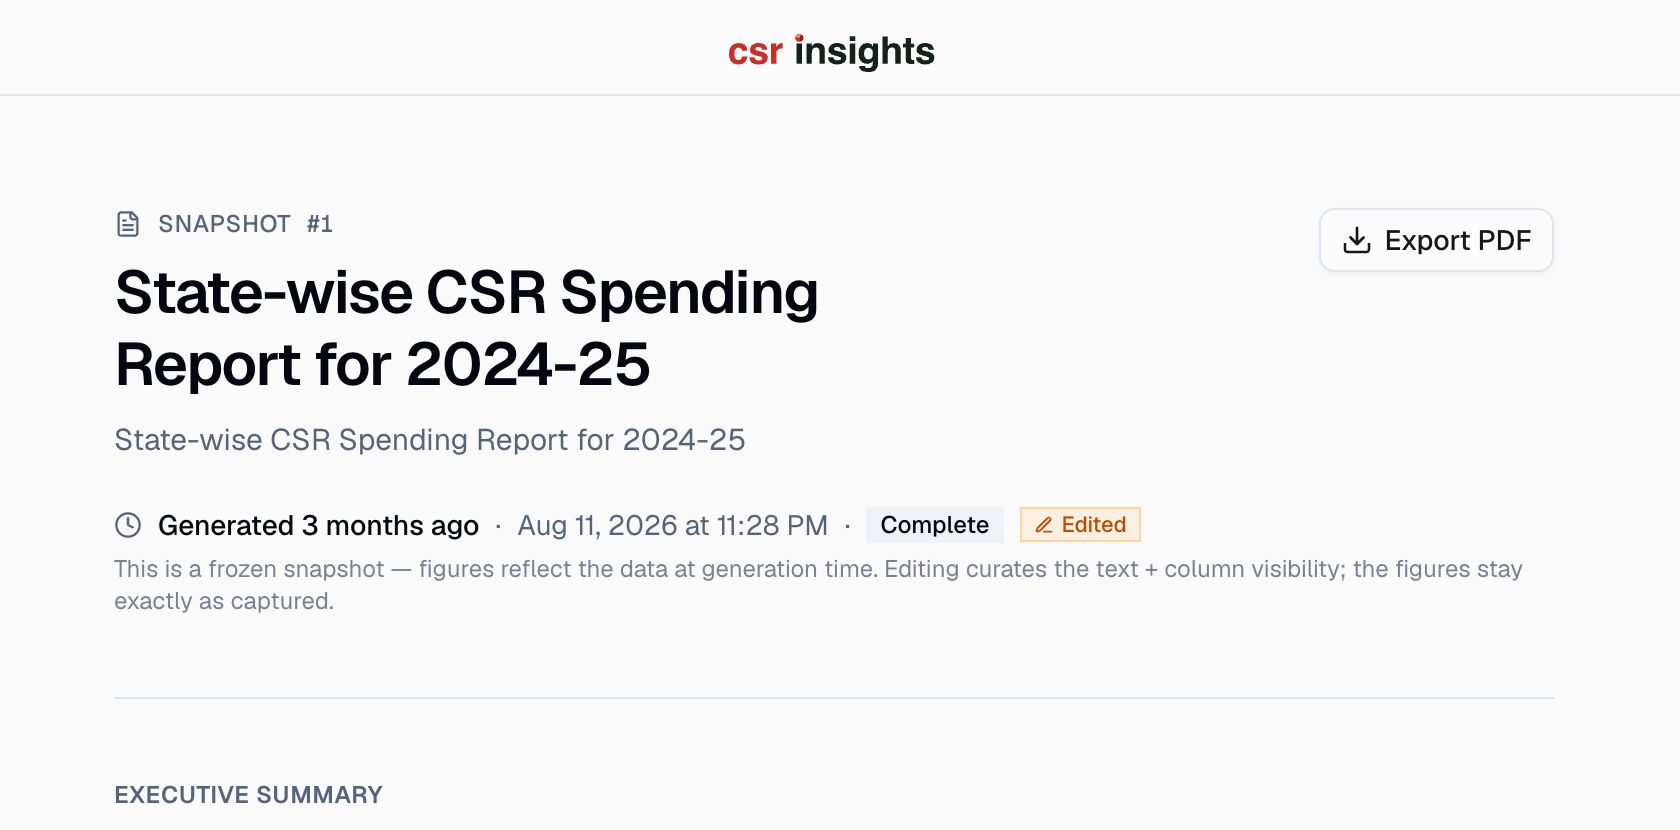
Fig. 5 A frozen report, ready for review. -
Step 5: See the pattern repeat
BRSR Insights runs the same engine on sustainability disclosures and cites the exact PDF.
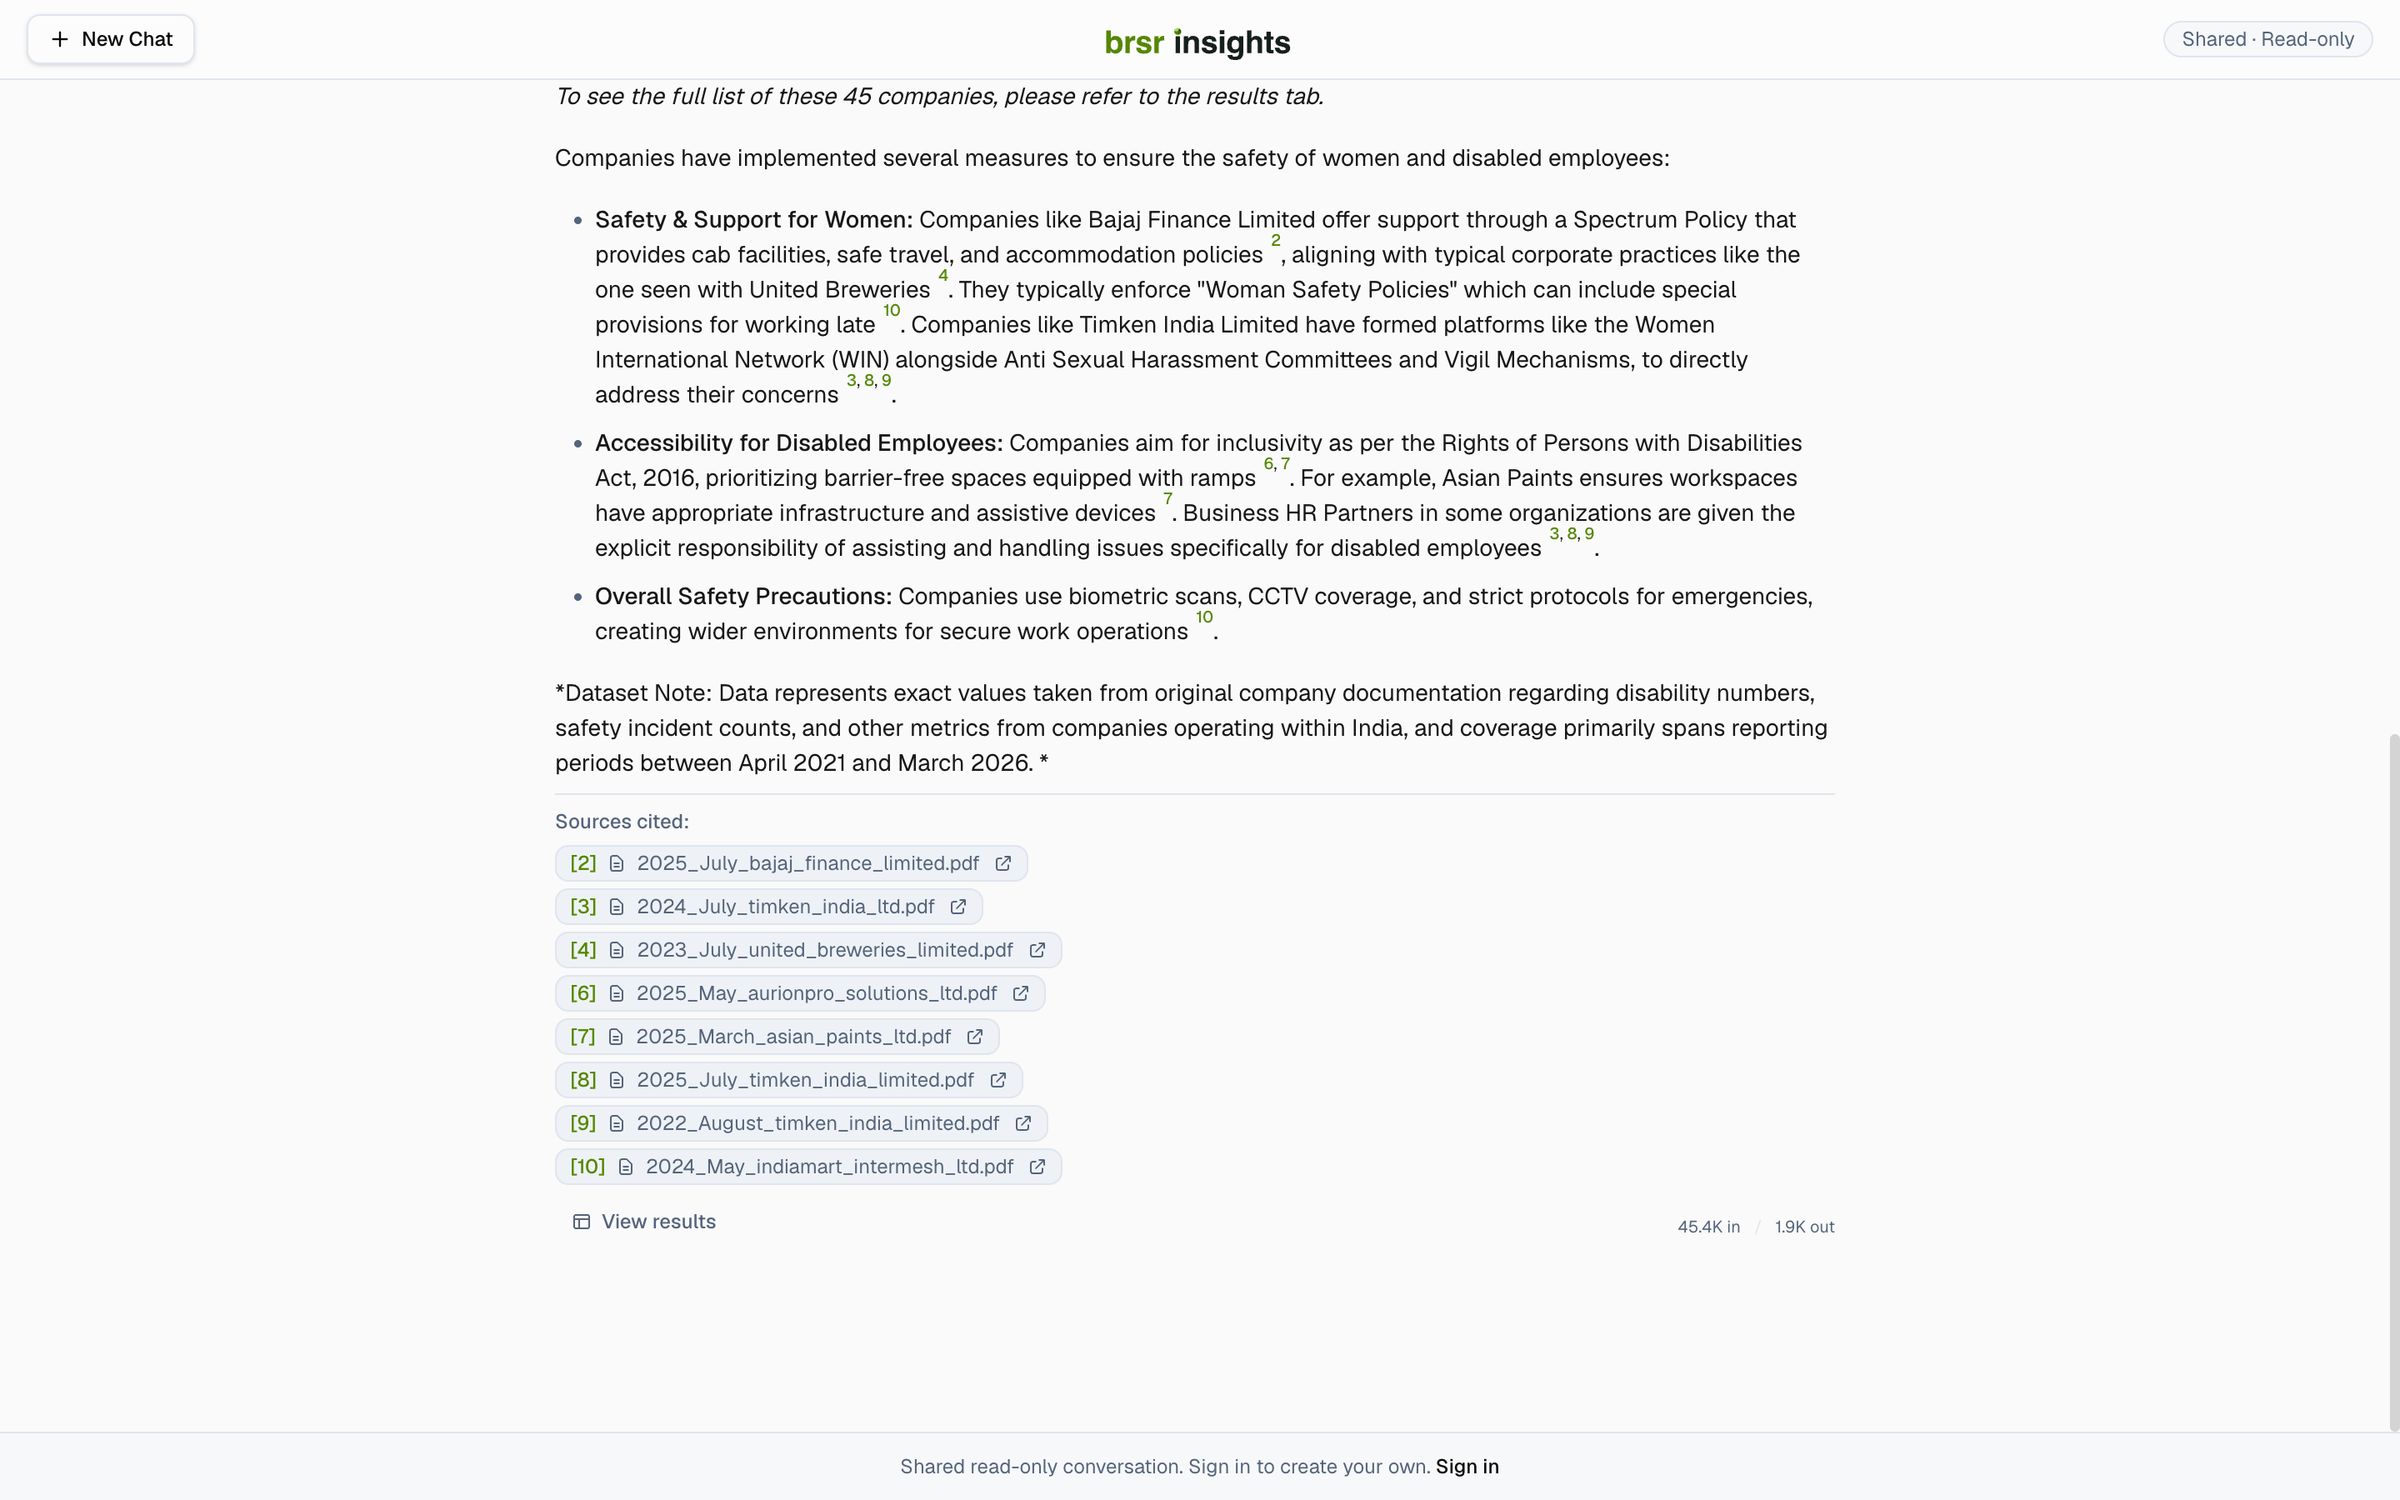
Fig. 6 BRSR Insights: the adjacent application, with document citations. -
Output
A cross-year, cross-state question answered in one session, with the query visible and the data documented.


§ 06 Evaluation
How we check it
-
The standardisation rules are documented, so users can judge what changed and why.
-
Source caveats are reproduced, not softened.
-
Report narratives are reviewed by a person before use.
§ 08 Limitations and lessons
Limitations and lessons
read this part first
Limitations
- The source data carries the ministry’s own caveats on completeness; CSR Insights shows them.
- A generated dashboard can present “Pan India” as a state; review is part of the workflow.
- Some BRSR filings disagree between PDF and XML; Dataful documents the resolution.
Lessons from operation
- A domain application is mostly data work and framing; the engine was already built.
- Standardise upstream. Entity reconciliation done once made every answer better.
- Guided modes with example prompts beat a blank chat box.
Sources (6)
- [1] CSR Insights: about the data · csr.dataful.in (opens external site)
- [2] Dataful: BRSR dataset page · dataful.in (opens external site)
- [3] CSR Insights: home · csr.dataful.in (opens external site)
- [4] BRSR Insights: home · brsr.dataful.in (opens external site)
- [5] Dataful: home · dataful.in (opens external site)
- [6] GoPie: home · gopie.ai (opens external site)
Sources reviewed 15 November 2026.
Discuss a project
Have a domain that deserves its own application?
Tell us about the data, the audience and the questions they ask.